

How to Select Ductile Iron Pipe Diameter? DN80 to DN2000 Complete Guide


Table of Contents
What Are the Consequences of Wrong Pipe Diameter Selection?
How to Calculate Design Flow Rate for Your Project?
What Is the Optimal Flow Velocity for Ductile Iron Pipes?
How to Calculate Friction Loss Using Hazen-Williams Equation?
How to Compare Total Lifecycle Costs for Different Pipe Sizes?
What Pipe Diameter Should You Select for Common Flow Rates?
How to Get Technical Support for Pipe Diameter Selection?
What Are the Consequences of Wrong Pipe Diameter Selection?
Selecting the correct pipe diameter is one of the most critical decisions in water infrastructure design. The choice affects not only initial material and installation costs, but also long-term operating expenses, system reliability, and maintenance requirements over 50+ years of service.
Undersizing Problems (Pipe Too Small)
When pipe diameter is too small for the required flow rate:
High friction loss: Increased pumping energy costs (can be 2-3× design estimate)
Low pressure at endpoints: Customer complaints, inadequate fire flow capacity
Excessive velocity: Pipe erosion, water hammer damage, noise complaints
Limited expansion capacity: Cannot accommodate future growth without expensive replacement
Frequent pump maintenance: Pumps operating outside optimal efficiency curve
Oversizing Problems (Pipe Too Large)
When pipe diameter is larger than necessary:
Excessive material cost: Each diameter increase adds 25-35% to pipe cost
Larger trench excavation: Wider trenches mean more earthwork and restoration cost
More expensive fittings: Elbows, tees, valves cost significantly more for larger sizes
Water age issues: Low flow velocity leads to water stagnation and quality degradation
Sediment accumulation: Velocity below 0.3 m/s allows particles to settle
How to Calculate Design Flow Rate for Your Project?
The foundation of pipe sizing is accurate flow rate estimation. Use this systematic approach:
Method A: Population-Based Calculation (Municipal Systems)
Qavg = P × q × 10-6
Where:
• Qavg = average daily flow (m³/day)
• P = population served (persons)
• q = per capita consumption (liters/person/day)
Typical per capita consumption values:
| Region/Type | Consumption (L/person/day) | Notes |
|---|---|---|
| Rural areas (developing) | 80-120 | Basic water supply |
| Urban areas (developing) | 120-200 | Standard municipal |
| Developed countries | 200-350 | High consumption |
| Industrial zones | 300-500 | Includes industrial use |
| Commercial districts | 150-250 | Offices, retail |
Example Calculation:
A town with 50,000 population, per capita consumption 180 L/person/day:
Qavg = 50,000 × 180 × 10-6 = 9,000 m³/day
Peak Flow Calculation
Design for peak flow, not average flow:
Qmax = Qavg × PF
Where:
• Qmax = maximum daily flow (m³/day)
• PF = peak factor (typically 1.5-2.5)
Peak factor guidelines:
Small towns (<10,000): PF = 2.5-3.0 (high variability)
Medium cities (10,000-100,000): PF = 2.0-2.5
Large cities (>100,000): PF = 1.5-2.0 (demand smoothing)
For the 50,000 population example with PF = 2.2:
Qmax = 9,000 × 2.2 = 19,800 m³/day = 229 L/s
Method B: Fixture-Based Calculation (Building Services)
For building water supply or industrial facilities:
Qmax = Σ (Fixture Units × Flow Rate × Diversity Factor)
Typical fixture unit values:
Residential faucet: 1 FU = 0.1 L/s
Shower: 2 FU = 0.2 L/s
Toilet flush: 3 FU = 0.3 L/s
Industrial process: Calculate based on equipment specifications
What Is the Optimal Flow Velocity for Ductile Iron Pipes?
Flow velocity is the key parameter that balances pipe cost against pumping cost. Understanding optimal velocity ranges prevents both undersizing and oversizing mistakes.
Velocity Range Guidelines
| Velocity Range | Classification | Application | Risk |
|---|---|---|---|
| < 0.3 m/s | Too Low | Avoid | Sedimentation, water quality issues |
| 0.3-0.6 m/s | Minimum | Gravity flow, low demand | Potential sedimentation |
| 0.6-1.0 m/s | Acceptable | Distribution networks | Safe range |
| 1.0-1.5 m/s | Economic | Transmission mains (RECOMMENDED) | Optimal balance |
| 1.5-2.0 m/s | Maximum | High-pressure systems | Increased surge risk |
| > 2.0 m/s | Excessive | Avoid for ductile iron | Erosion, water hammer, noise |
Velocity Calculation
Calculate velocity from flow rate and pipe internal diameter:
V = Q ÷ A
Where:
• V = velocity (m/s)
• Q = flow rate (m³/s)
• A = pipe cross-sectional area (m²) = π × (ID/2)²
Example: 229 L/s (0.229 m³/s) through DN400 K9 pipe (ID = 411mm = 0.411m):
A = π × (0.411/2)² = 0.133 m²
V = 0.229 ÷ 0.133 = 1.72 m/s (acceptable but high)
Try DN450 K9 (ID = 462mm = 0.462m):
A = π × (0.462/2)² = 0.168 m²
V = 0.229 ÷ 0.168 = 1.36 m/s (optimal economic velocity ✅)
How to Calculate Friction Loss Using Hazen-Williams Equation?
After selecting a trial diameter based on velocity, verify that friction loss is acceptable for your system:
Hazen-Williams Equation
hf = 10.67 × L × Q1.852 ÷ (C1.852 × D4.87)
Where:
• hf = friction head loss (m)
• L = pipe length (m)
• Q = flow rate (m³/s)
• C = roughness coefficient
• D = internal diameter (m)
Hazen-Williams C values:
Cement-lined ductile iron (new): C = 140-150
Cement-lined ductile iron (20 years): C = 130-140
Cement-lined ductile iron (50 years): C = 120-130
HDPE: C = 150-155
Steel (new): C = 140-145
Steel (corroded): C = 80-100
Acceptable Friction Loss Ranges
| Application | Acceptable Loss (m/km) | Rationale |
|---|---|---|
| Transmission mains (long distance) | 1-3 m/km | Minimize pumping costs over long distances |
| Distribution networks | 3-5 m/km | Balance pipe cost vs. pumping cost |
| Building services (short runs) | 5-10 m/km | Higher loss acceptable for short distances |
Friction Loss Example
For DN450 K9 pipe, 229 L/s flow, 15km length, C = 140:
hf = 10.67 × 15,000 × (0.229)1.852 ÷ (1401.852 × 0.4624.87)
hf = 10.67 × 15,000 × 0.0687 ÷ (9,892 × 0.0234)
hf = 11,020 ÷ 231 = 47.7 m total
hf per km = 47.7 ÷ 15 = 3.18 m/km ✅ (acceptable for transmission main)

How to Compare Total Lifecycle Costs for Different Pipe Sizes?
Optimal pipe diameter minimizes total lifecycle cost, not just initial material cost:
Lifecycle Cost Components
TLC = Pipe Cost + Installation Cost + Pumping Cost (NPV) + Maintenance Cost
Typical cost distribution over 50 years:
Pipe material: 15-20%
Installation (trench, bedding, backfill): 25-35%
Pumping energy (NPV): 40-50%
Maintenance & repairs: 10-15%
Pumping Cost Calculation
Annual pumping cost depends on friction loss and electricity price:
Annual Cost = (ρ × g × Q × hf × Hours × Electricity Price) ÷ (Pump Efficiency × Motor Efficiency)
Where:
• ρ = water density (1000 kg/m³)
• g = gravity (9.81 m/s²)
• Q = flow rate (m³/s)
• hf = total friction head (m)
• Hours = operating hours/year (typically 8,760)
• Electricity Price = $/kWh (varies by region)
Example: DN450 vs DN500 comparison for 15km main, 229 L/s:
| Cost Component | DN450 | DN500 | Difference |
|---|---|---|---|
| Pipe material cost | $480,000 | $620,000 | +$140,000 |
| Installation cost | $320,000 | $400,000 | +$80,000 |
| Annual pumping cost | $42,000/year | $28,000/year | -$14,000/year |
| 50-year pumping (NPV @5%) | $764,000 | $509,000 | -$255,000 |
| Total Lifecycle Cost | $1,564,000 | $1,529,000 | -$35,000 savings |
What Pipe Diameter Should You Select for Common Flow Rates?
Use this quick reference chart for preliminary pipe sizing (assuming economic velocity 1.0-1.5 m/s):
| Flow Rate (L/s) | Recommended DN | Velocity (m/s) | Typical Application |
|---|---|---|---|
| 5-15 L/s | DN80-DN100 | 0.8-1.2 | Building connections, small branches |
| 15-40 L/s | DN150-DN200 | 0.9-1.3 | Residential streets, small networks |
| 40-80 L/s | DN250-DN300 | 0.9-1.4 | District mains, commercial areas |
| 80-150 L/s | DN350-DN400 | 0.9-1.4 | City trunk lines, transmission |
| 150-250 L/s | DN450-DN500 | 0.9-1.4 | Major transmission, regional supply |
| 250-400 L/s | DN600-DN700 | 0.9-1.4 | Primary mains, intercity transfer |
| 400-700 L/s | DN800-DN1000 | 0.9-1.4 | Large transmission, mega projects |
| > 700 L/s | DN1200-DN2000 | 0.9-1.4 | Special applications, raw water |
How to Get Technical Support for Pipe Diameter Selection?
If you are designing water transmission or distribution systems, proper pipe diameter selection requires careful hydraulic analysis and lifecycle cost evaluation.
Tiegu integrates production capacity across qualified Chinese foundries, delivering compliant and high-quality casting products to buyers worldwide. For water infrastructure projects, we provide technical support for pipe diameter selection, hydraulic calculations, and supplier matching based on project specifications and budget constraints.
Share your pipeline layout, design flow rate, and pressure requirements to receive supplier recommendations with appropriate pipe diameters and competitive quotations.
📋 Get Free Technical Quotation
Summary Answer
4-step sizing method: Calculate flow rate → select velocity (1.0-1.5 m/s) → verify friction loss (1-5 m/km) → compare lifecycle costs
Population formula: Qavg = P × q × 10-6, then multiply by peak factor (1.5-2.5) for design flow
Economic velocity: 1.0-1.5 m/s balances pipe cost vs. pumping cost for most applications
Friction loss: Use Hazen-Williams equation with C = 140-150 for cement-lined ductile iron
Lifecycle cost: Pumping energy is 40-50% of 50-year cost — larger diameters often save money long-term
Quick reference: DN80-DN100 (5-15 L/s), DN200-DN300 (40-80 L/s), DN400-DN500 (80-250 L/s)
📞 Contact Tiegu for Pipeline Solutions
WhatsApp / WeChat: +86 152 5613 5588
Email: zbw@tiegu.net
Website: www.ductileironpipe2600.com
Inquiry Form: Submit Your Requirements
Response Time: Within 24 hours
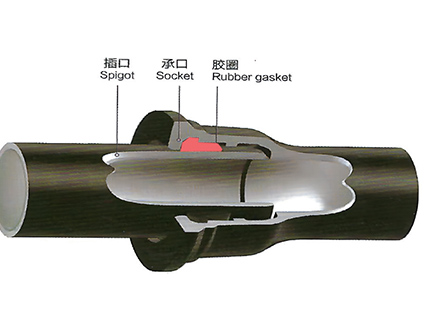 GT-type Joint Ductile Iron Pipe
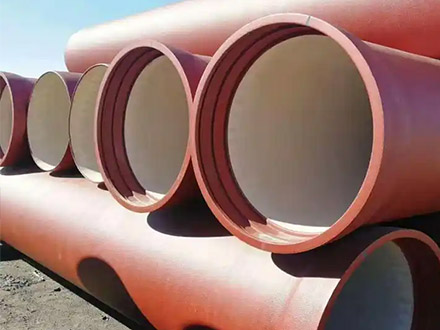
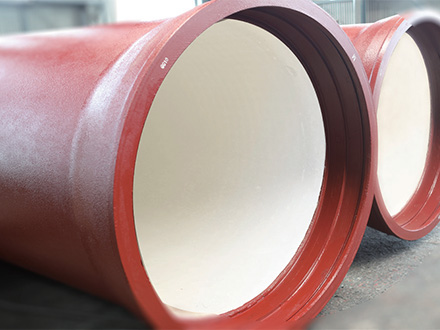 Sewage Pipe (Ductile Iron Sewage Pipe)
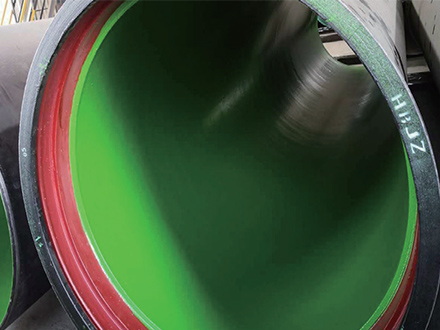 Special Coating Pipe (Ductile Iron Pipe with Special Coatings)